Did Something In The Market Just Change? (SPX) - Seeking Alpha
Justin Sullivan
Technical Note - Did Something in the Market Just Change?
- New sell signal from tech stocks mirrors prior Market turning points.
- Conditions are very similar to tops in '00, & '07.
- Valuations at levels beyond almost any fundamental defense.
- Huge gov't funding over next 6 weeks & yield curve inversion signal trouble ahead, especially for long duration assets
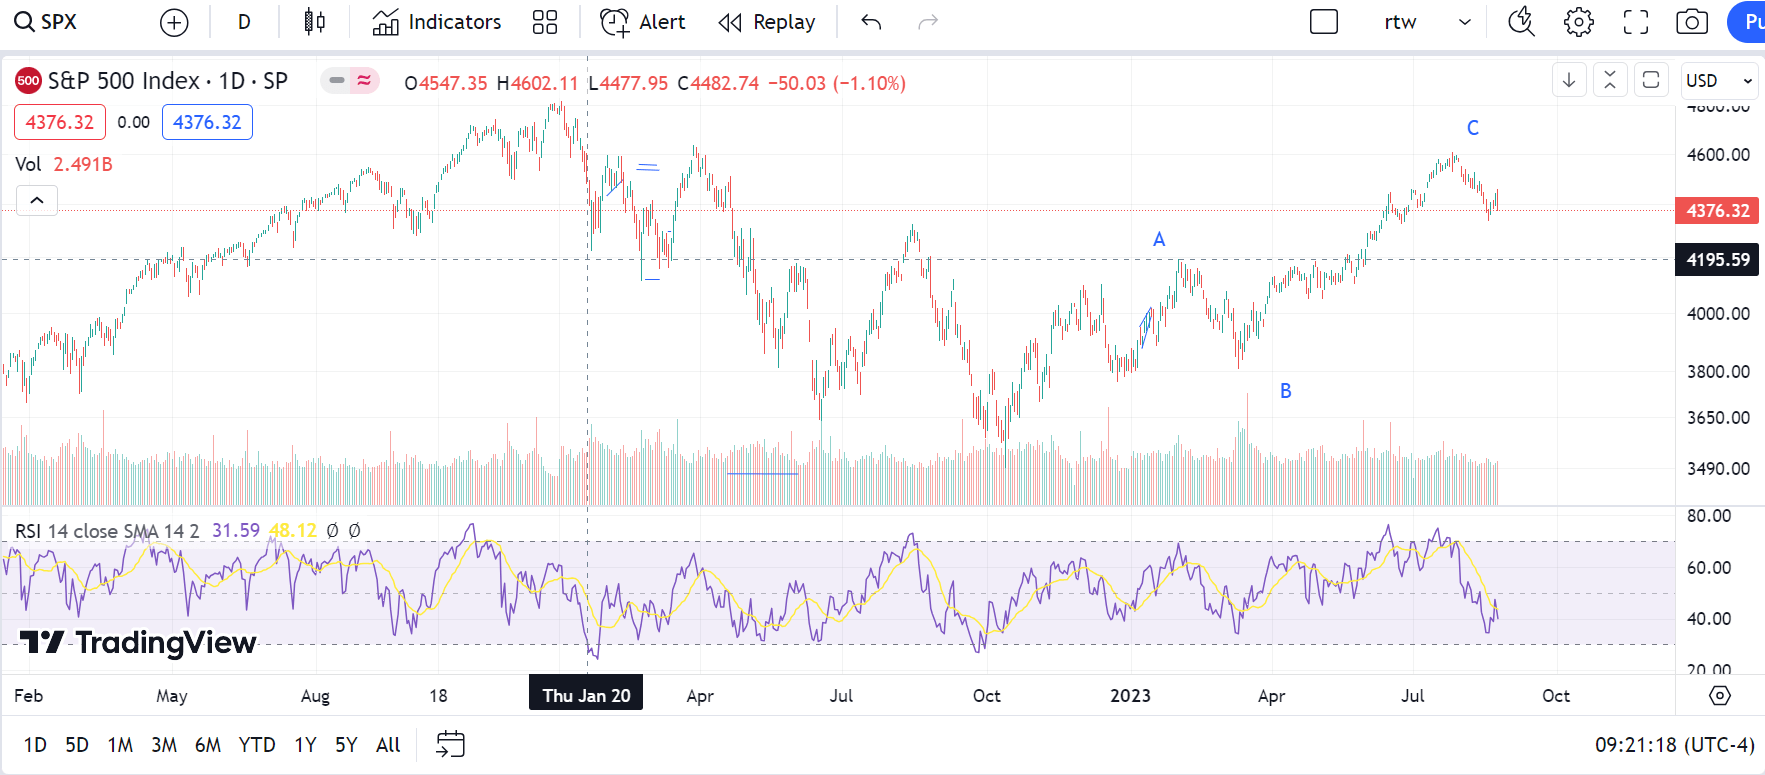
(TradingView.com)
Macro Perspective
Market conditions are behaving in very similar ways to the periods approaching the tops of 2000 and 2007. Nvidia's (NVDA) recent performance, up to and after a truly impressive quarterly report, brings back memories of the many tech bubbles we have studied and several that we have experienced. With rates at relatively high levels, but arguably well below sustainable levels considering the current makeup of inflationary expectations. Consumer spending appears to be shifting after the massive stimulus over 3 years. Labor settlements suggest substantial upside potential for higher inflation along with other components like food and energy costs that continue to rise. Long bonds appear to be in one of the first bear markets not entirely driven by the Fed since '08/09 time frame.
A key aspect of the current debate about economic conditions is jobs, which have been stronger than expected after the Fed rate hikes. Bulls argue no recession happens with such a low jobless rate. Bears say that the numbers are likely flawed or that the drop in openings is a recession signal. We think robust jobs reflects middle class 2nd or even 3rd jobs, which show up as full-time employment in the stats. The GDP/GDI average is signaling recession despite strong jobs.
Commodities like oil looks bullish, which could increase inflationary costs for consumers and complicate government deficit financing efforts considerably ahead of pre-election posturing. Geopolitical risks of oil prices are potentially rising as BRICS and OPEC try to gain advantages over Western countries. If China stimulus attempts succeed, higher oil is likely; if not, then a respite could temper commodity gains. Either way, we see a more challenging 2H23 ahead.
Inflation May Not Go Away So Easily
Signs of persistent inflation showed up in recent reports. Prior consensus was that inflation would drift down to 2% relatively soon. Should it not continue its freefall, due to many of the potential areas of risk cited above, the Fed would likely need to continue rate hikes as it suggested in testimony this week. The potential downside pressure from higher rates on long-duration assets such as tech stocks, PE & VC portfolios and long bonds could be substantial. Food prices have continued to rise, while salary demands continue to drive components of inflation higher.
Since even Tbills vastly understate the actual rate of inflation (see Shadow Government Statistics), investors would ordinarily need to reach for yield to cover the loss of purchase power, something bond holders take very seriously. Current 10 year rates, however, done even cover existing inflation using CPI. As the government sells a very large amount of new debt plus refinancing maturing debt, the market has become much less welcoming than in the past. We think yields could be forced higher.
The trailing 4 quarters of interest is $3.2t(!) or 50%+ of the F23 budget or a shocking 65% of last year's total tax receipts). Federal Interest payments The twin impacts of budget busting debt service costs and new Fed rate hikes could seriously hurt long-duration assets like tech stocks, PE/VC funds and long bonds.
We believe it's a powerful negative motivator threatening markets that have largely ignored the vast gap between true inflation and valuations based on an accurate reading of the risk-free rate. Tech stock valuations, such as Nvidia's unbelievable 20x sales, represents the kind of risk we last saw during the final days of the dot.com and 2006-7 housing eras.
Trends Suggest Dollar Weakness vs The Euro
Our proprietary Supply/Demand models suggest that the dollar could face downward pressure in the coming months. With technical patterns hitting double tops or nearly so for the SPX and tech stocks, we think the potential for new sell signals could be warning of a significant correction into the Fall.
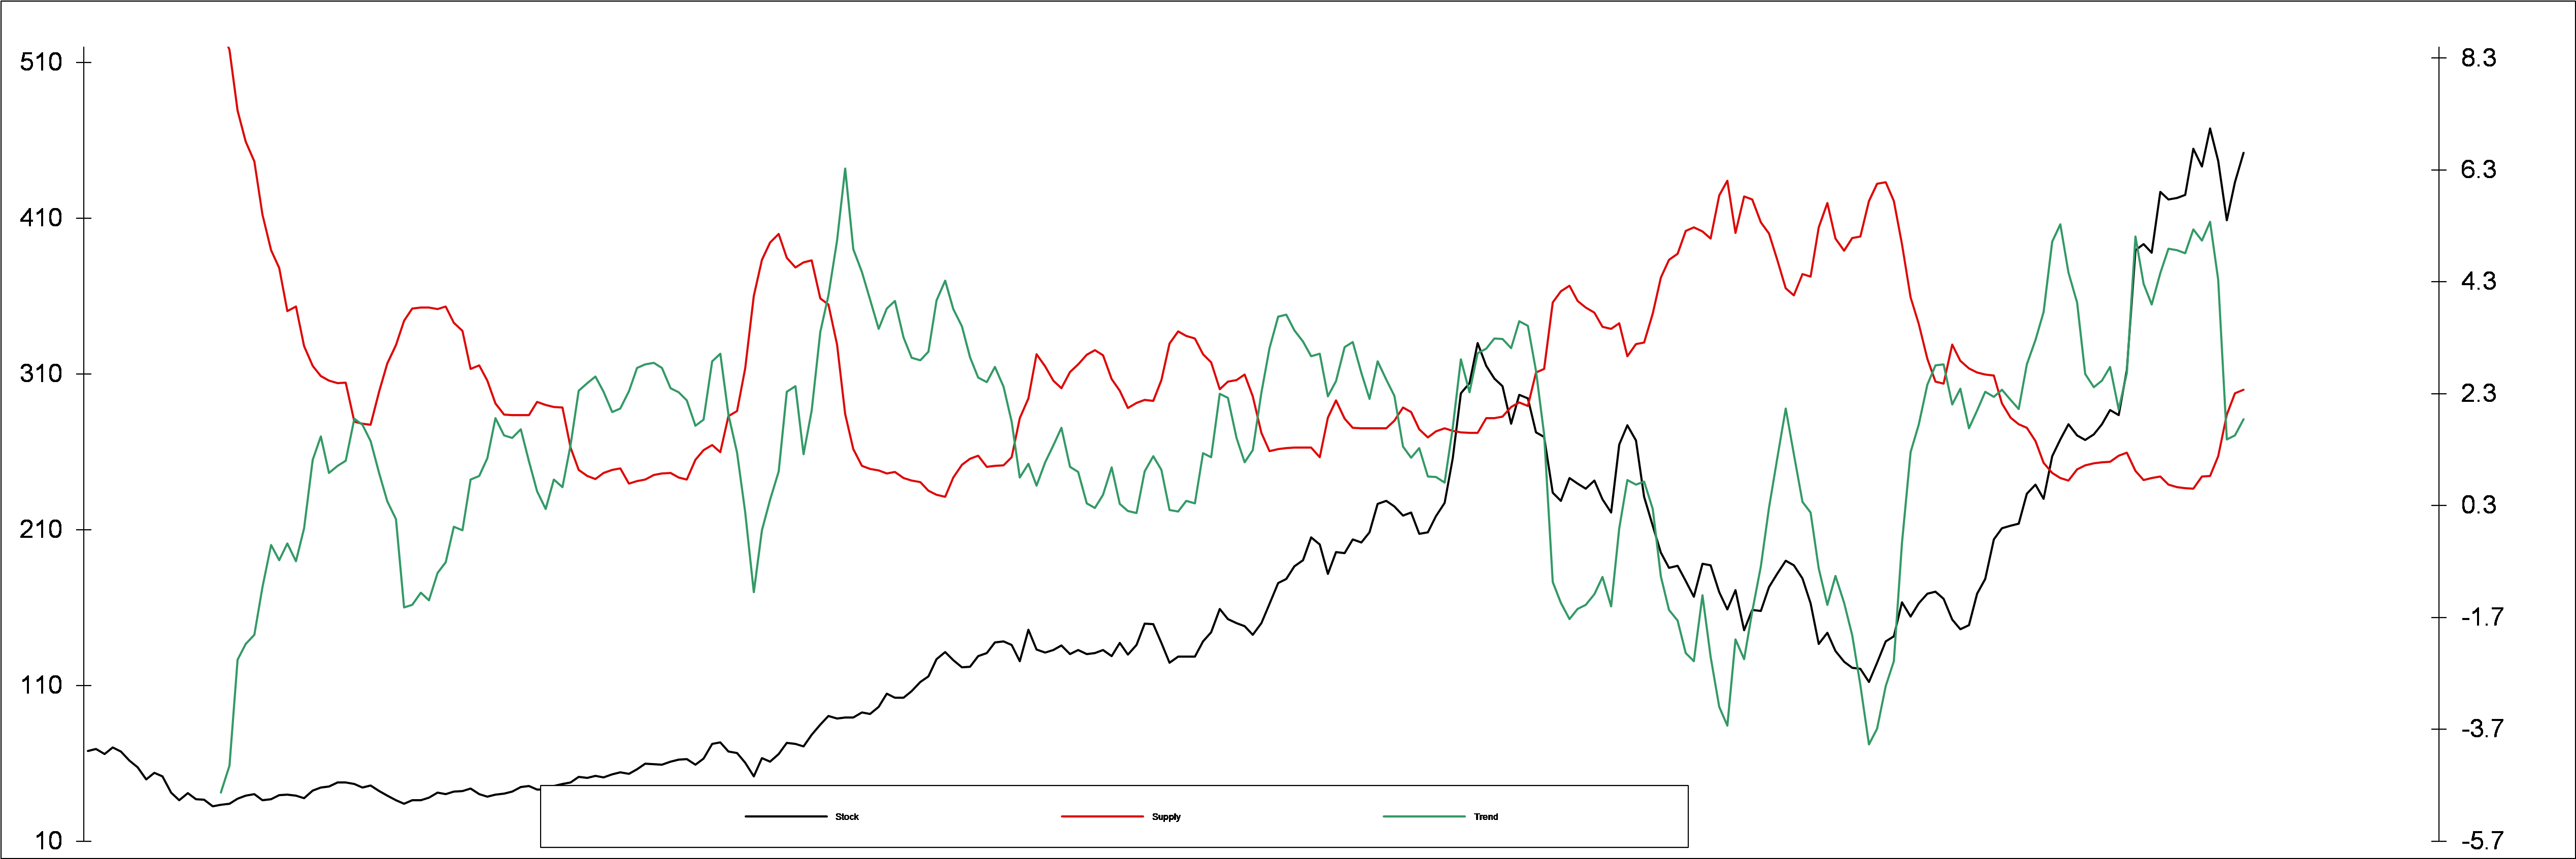
S&P500 Weekly Supply/Demand Chart
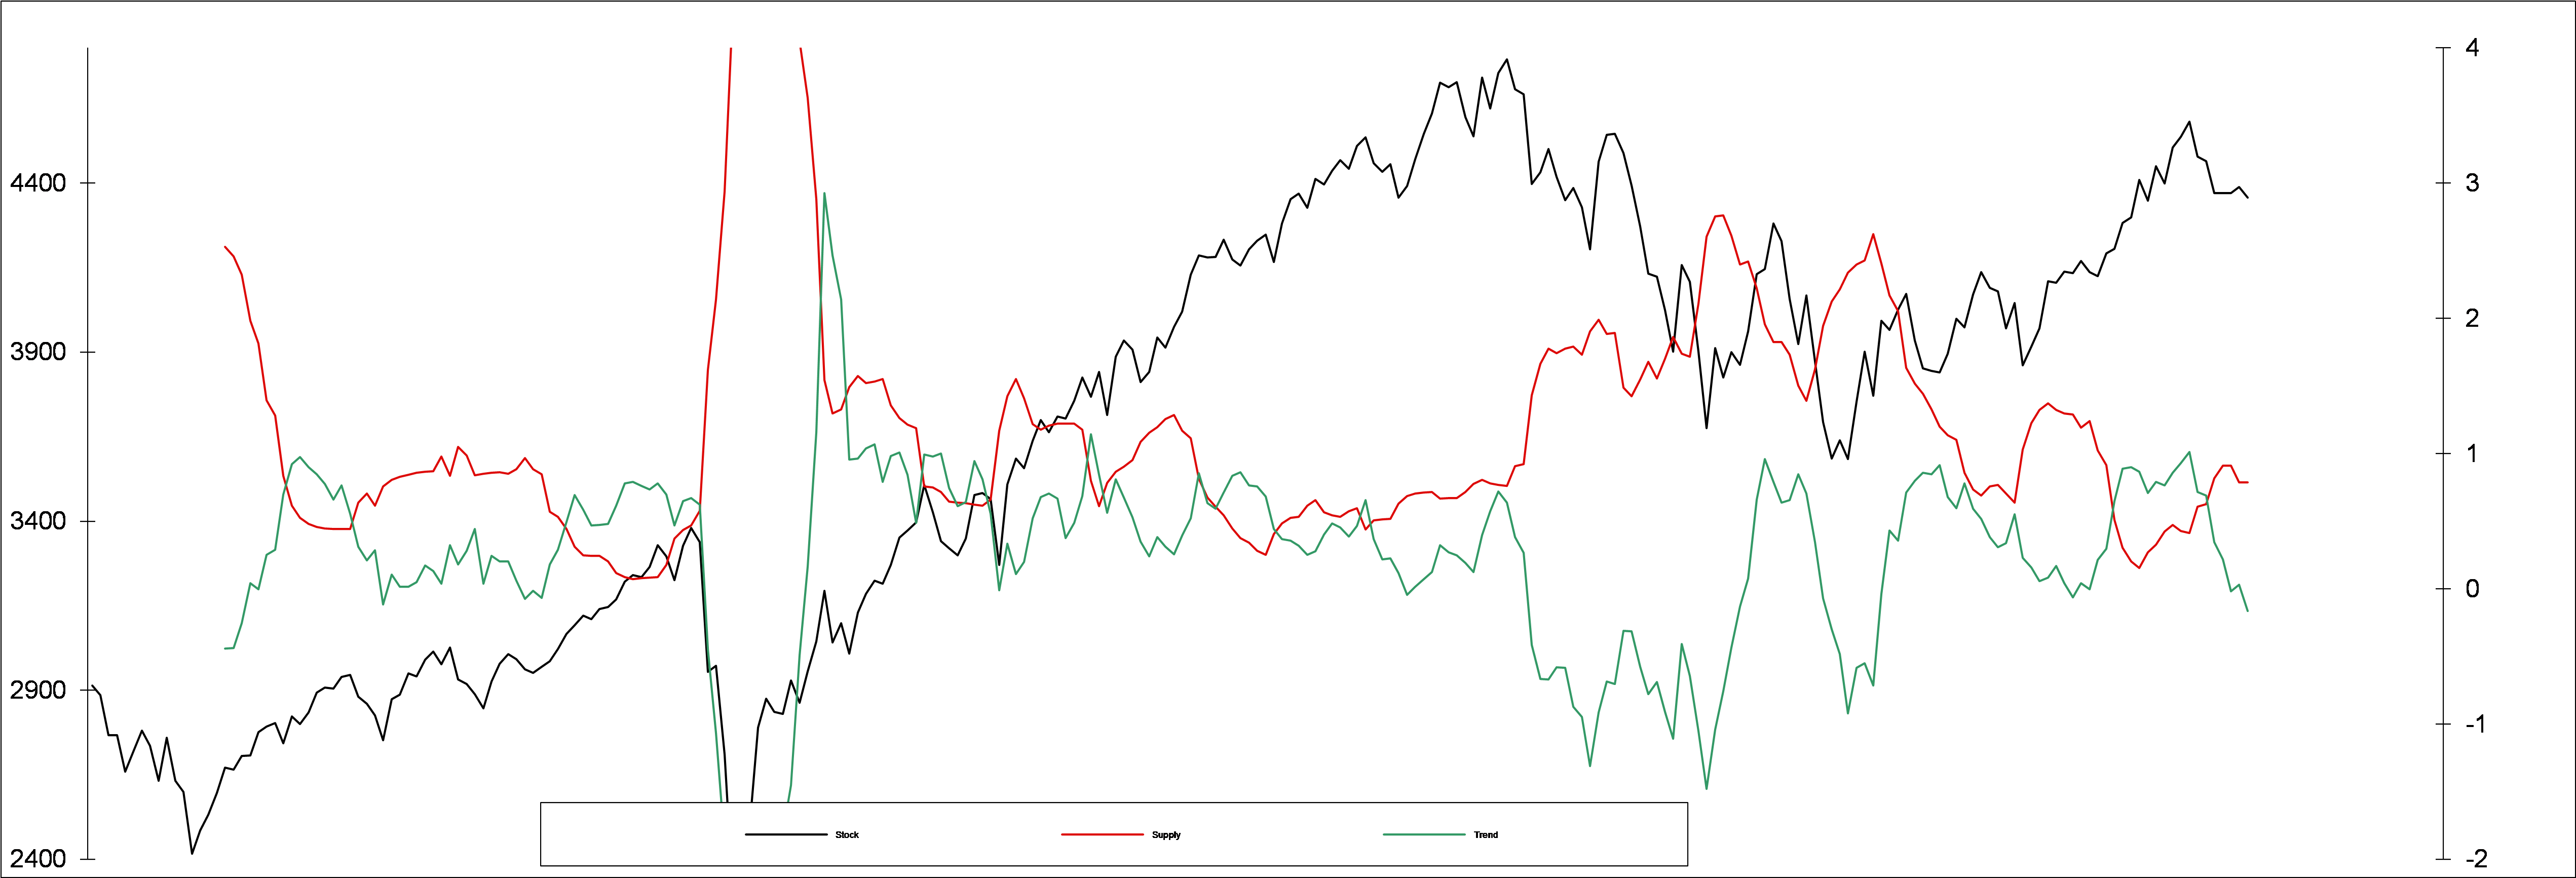
Stocks are on a longer term sell signal with room to run lower (Source: Summit Analytic Partners Research)
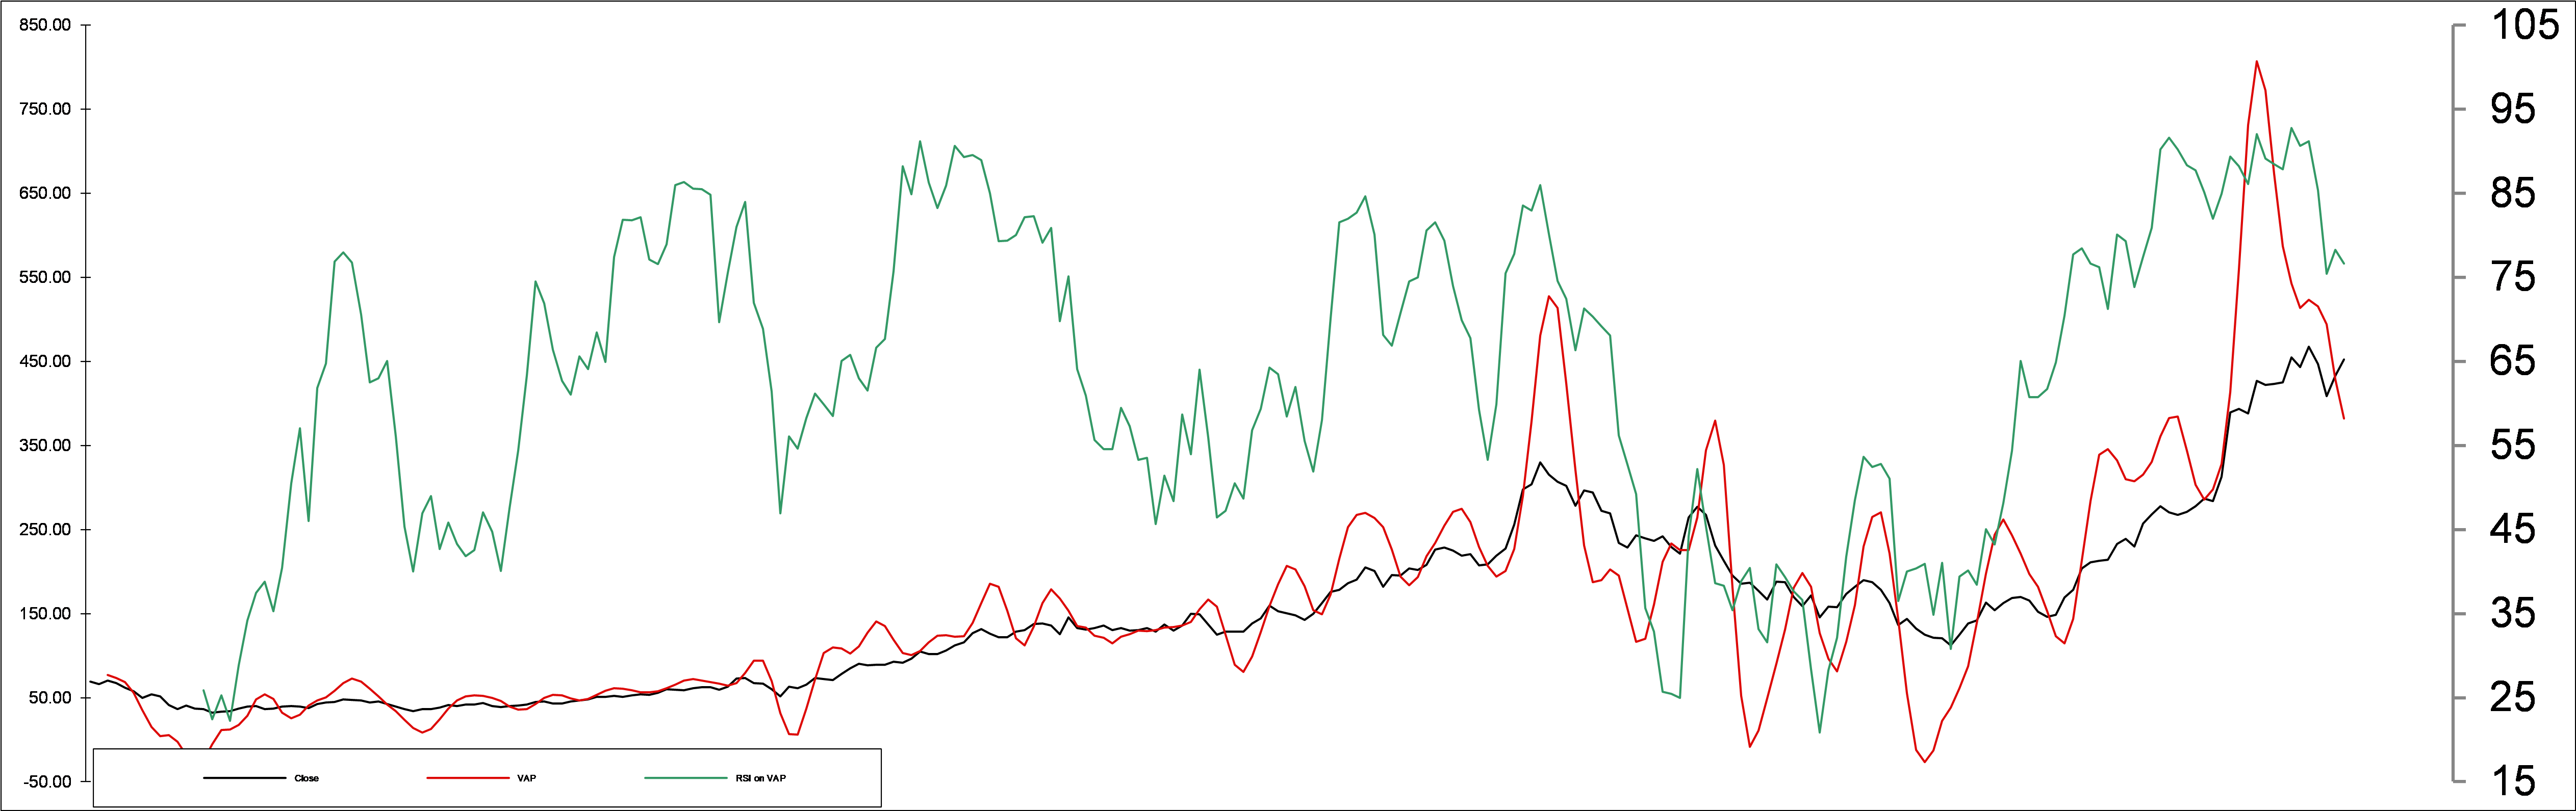
Volume-Adjusted Price Weekly Chart
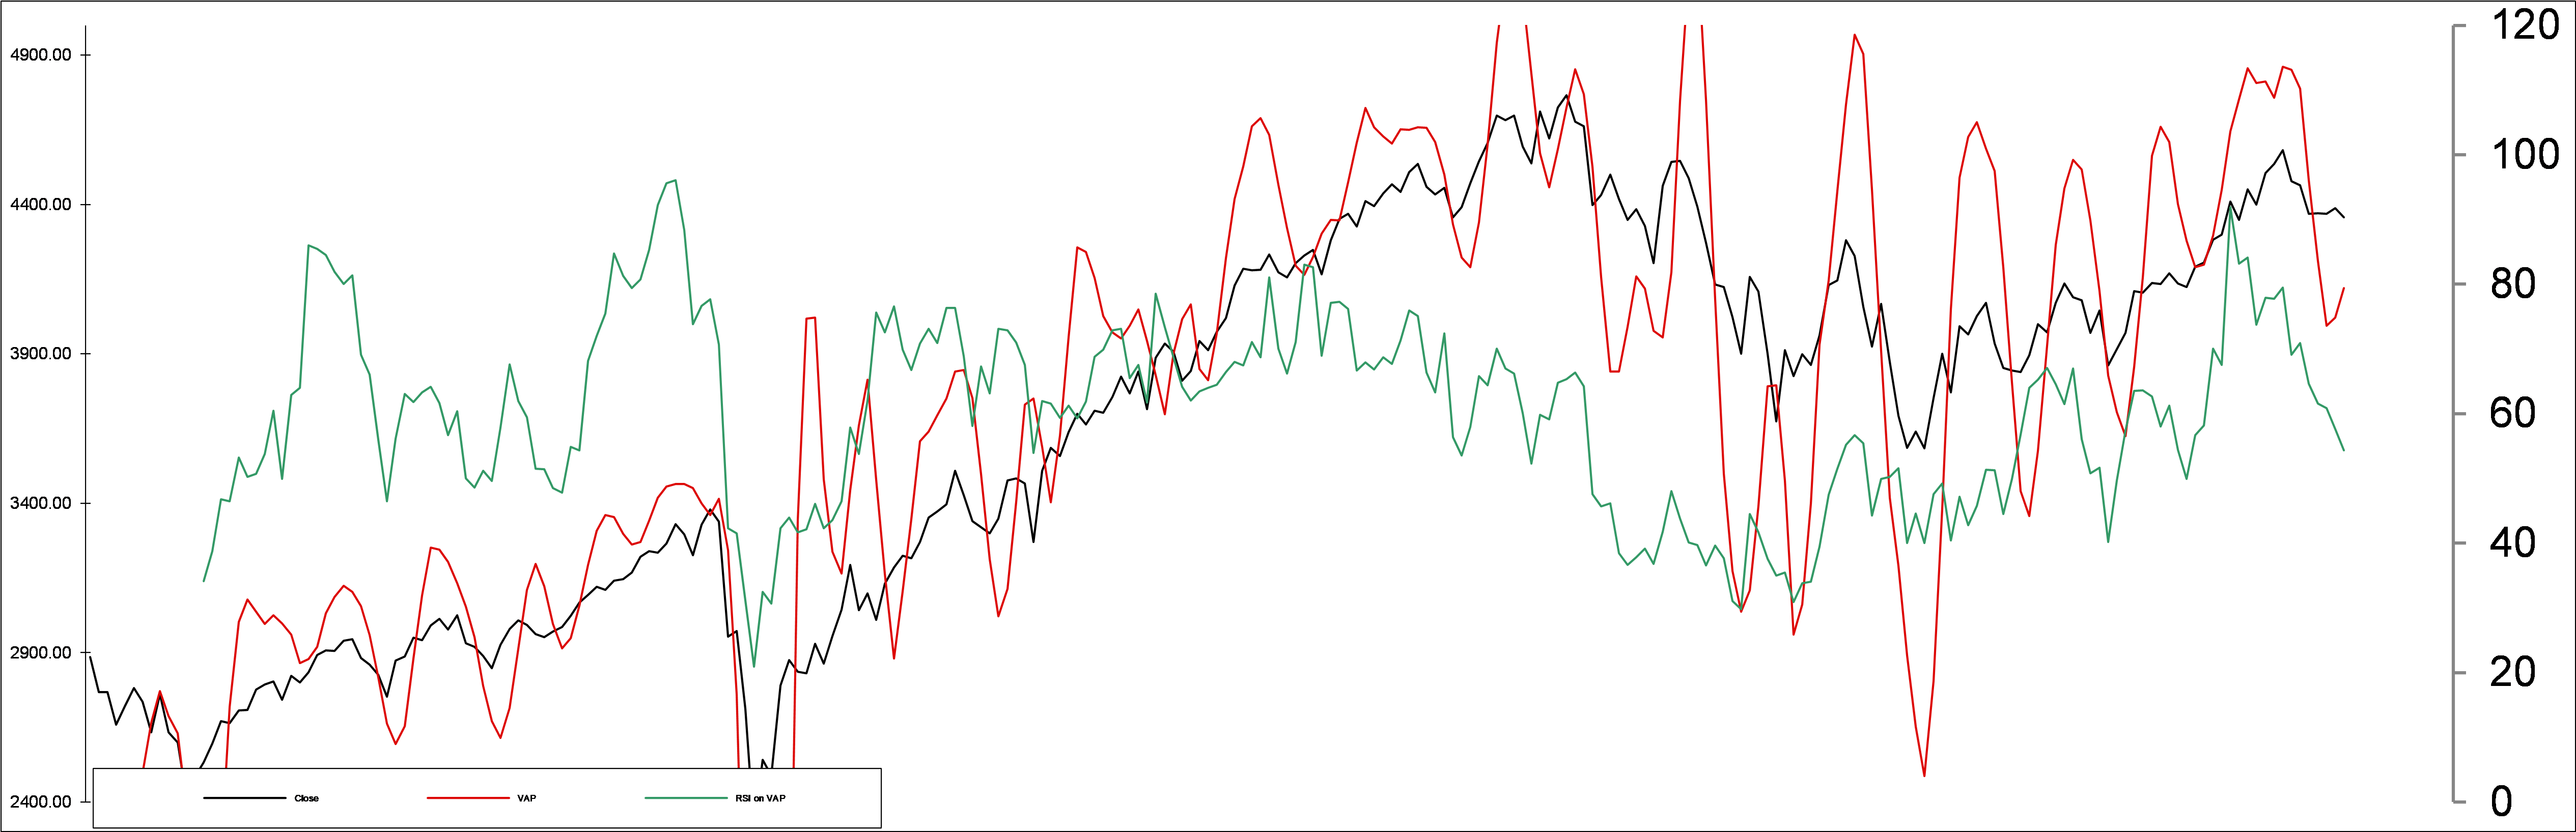
Momentum (green) is bearish - VAP (red) is testing its trendline support from the recent rally (Source: Summit Analytic Partners Research)
Our weekly SPX model shows a longer-term sell signal that suggests the Market could trade substantially lower into the Fall. The scope for further declines until meaningful support can be found concerns us. Similarly, Nvidia's trading action after its remarkable eps report is telling from the perspective of several tech bubble tops. That traders are selling heavily into a far better upside surprise than anything we can recall suggests to us a real possibility of a sea-change in the outlook for long duration assets, which could prove damaging to tech stocks trading at valuation levels not seen in decades.
NVDA Weekly Supply/Demand Chart
At 20x Sales(!) the LT sell has substantial room to run lower (Source: Summit Analytic Partners Research)
Volume-Adjusted Price Weekly Chart
Momentum (green) is bearish - VAP (red) is falling hard - Key support is far below (Source: Summit Analytic Partners Research)
Supply/Demand for NVDA went into a sell mid-July and only made a minor bounce on the August rally into earnings. The fact that support is so far away disturbs us as we contemplate higher rates. Money flow is falling hard, but again has a long way to go until a more constructive pattern can provide support. Clearly institutional demand for stocks, and NVDA in particular, has been falling in August.
Euro/Dollar Weekly Supply/Demand Chart
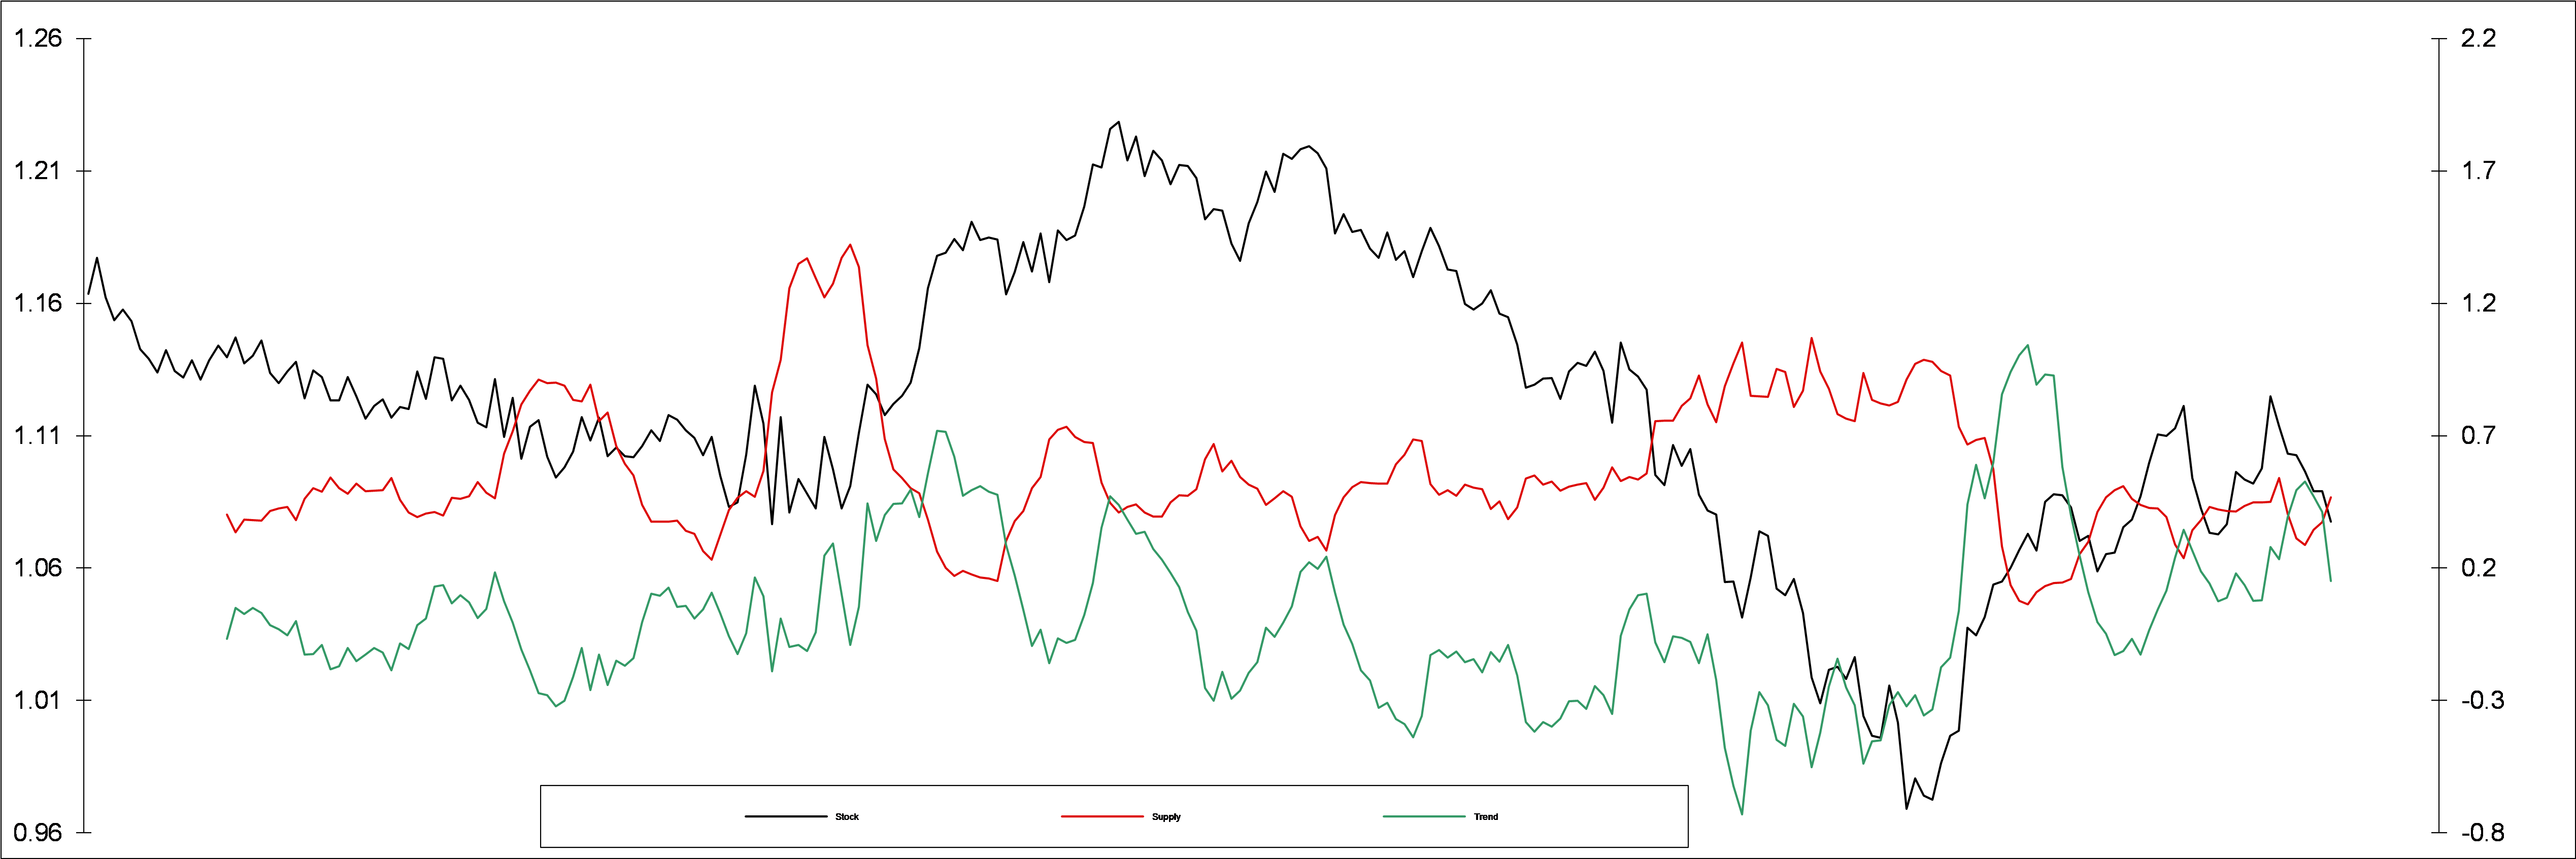
Sell pattern showing room for US Dollar weakness ahead (Source: Summit Analytic Partners Research)
Volume-Adjusted Weekly Price Chart
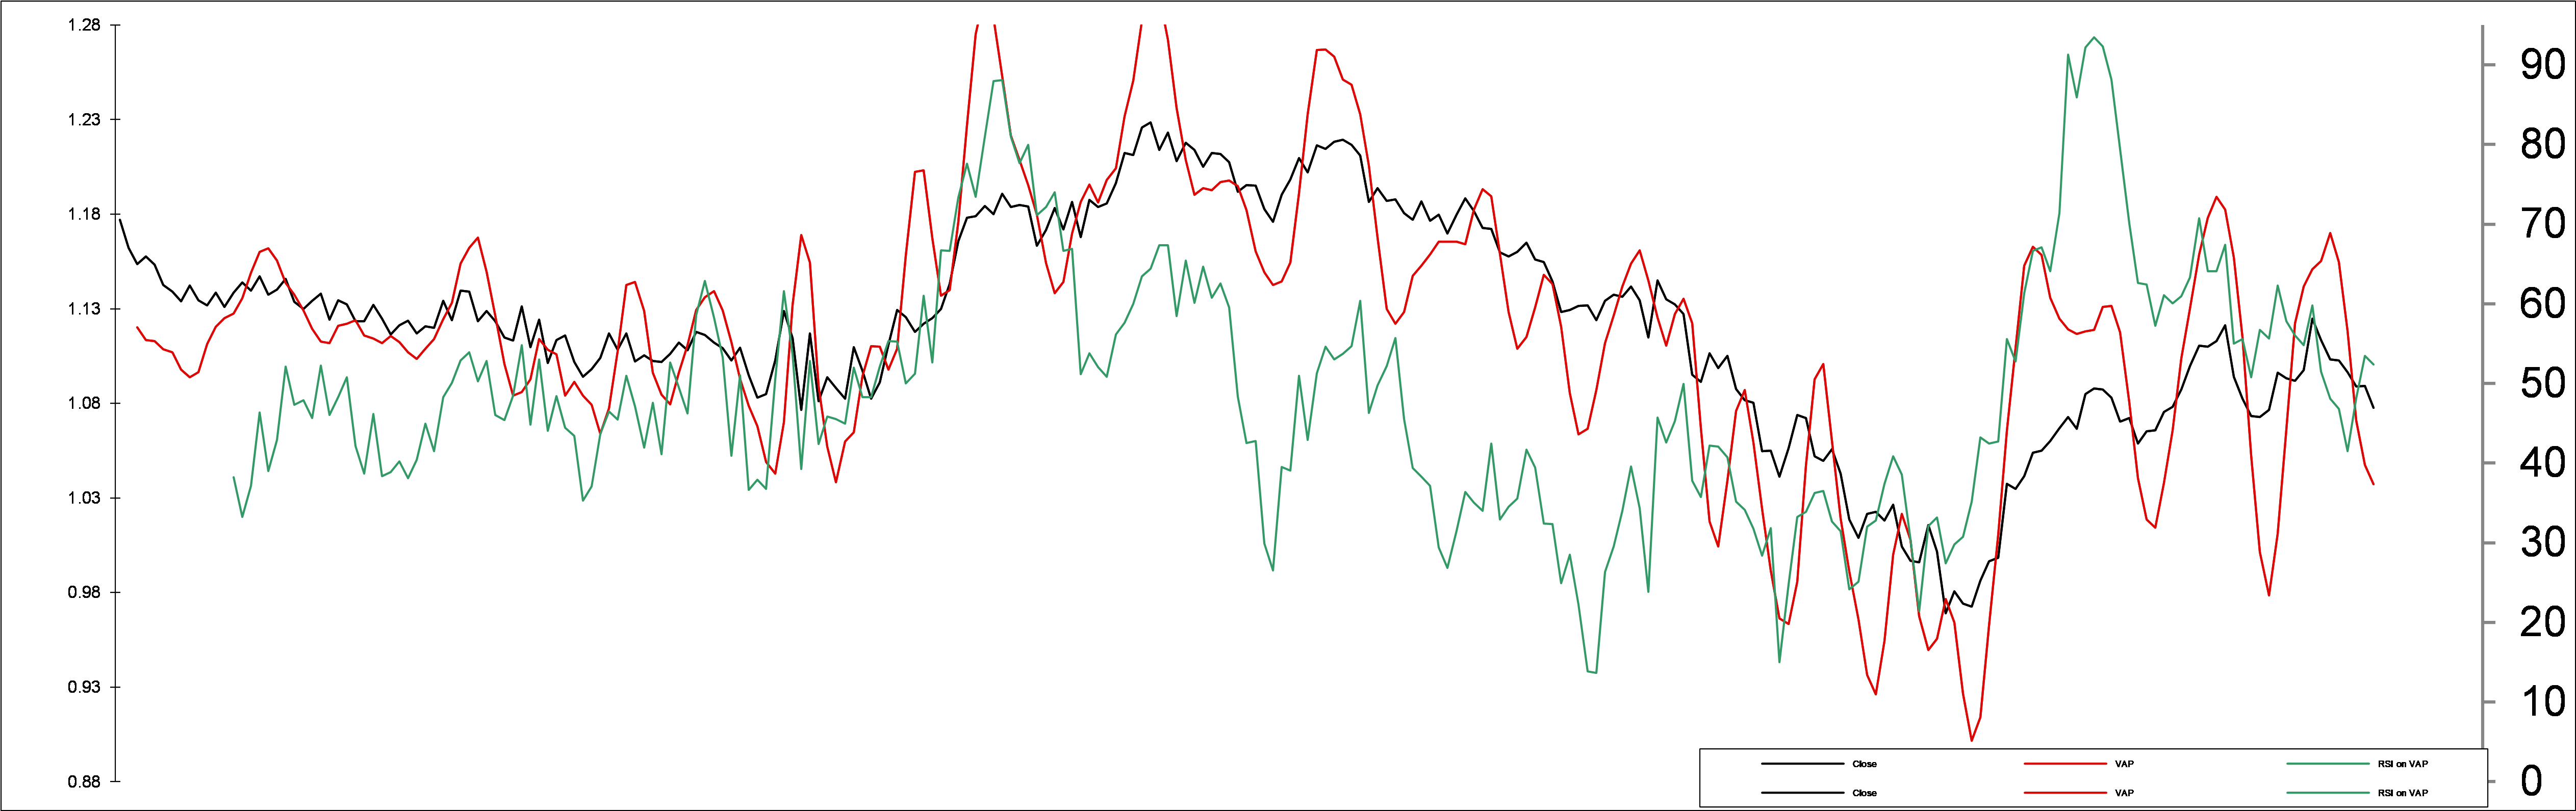
VAP is falling but a little more slowly - Momentum (green) is just turning bearish again (Source: Summit Analytic Partners Research)
Risks
Liquidity from the Infrastructure and Anti-Inflation deficit spending is a powerful force in the marketplace. Recent signs of consumer weakness, interestingly at the high-end for a change, suggests that stimulus money may finally be running low after an epic surge. We think the Market may be signaling that the liquidity cycle may be ready to reverse, following the enormous deficits from government overspending. If so, then we can expect fundamentals to reassert themselves forcefully given the extremes in valuations. Once they do, expect harder times for stock valuations. If not, then our thesis may be postponed by weeks or even months.
We have seen 3 quarters running of weaker earnings, despite beating expectations. With margin pressures persisting and inflation running well beyond Fed rates (especially using 1980 metrics which show CPI almost double the Greenspan version currently used), valuations are stunningly high and subject to considerable downside adjustment once the flood of buying power slows. We think the early summer highs and heavy institutional distribution of stock since may be signaling a change in risk tolerance going into the seasonally dangerous Fall. But the Atlanta Fed's GDP-Now indicator is showing a substantial uptick in economic growth that could undermine our and the market's calculus.
A third risk to our outlook is that China's economic challenges could devolve into full-blown deflation, which could lead to a selloff in commodities as it struggles to pay foreign debts. If commodities start to fall and oil demand weakens, inflationary pressures could at least temporarily ease. That would take pressure off rates and help the Fed to further slow economic activity levels. We hear from industry sources that supply chains have normalized so are likely done transitioning higher costs through value chains. Thus any reduction in inflationary pressures would help keep rates from rising and avoid revaluing long duration assets lower over the coming months. We still see ample signs of higher inflation. For example, a recent survey indicated that a remarkable 63% of Millennials expect to change jobs for higher pay this year; 55% of older workers have similar expectations (The Deloitte Global 2022 Gen Z and Millennial Survey). If inflation surges after a brief respite, Central Banks would need to raise rates further to destroy excess demand. The odds of precipitating a recession would grow exponentially in our view, resulting in weaker demand and substantial downside for stock prices.
The Trade
We believe that SPX and tech stocks like NVDA are poised to correct over the next several weeks to months. RSI is diverging bearishly on SPX, peaking on 7/26 on an RSI negative divergence. By our modified Fibonacci methods, we count SPX as a double top. Our proprietary Supply/Demand models show an early stage sell signal that confirmed with the upside trend break after 7/26. Volume-adjusted price seconded the signal and its momentum measure indicated a bearish divergence ahead of the price highs on SPX. With so much scope for lower levels, weekly S/D may be signaling that a powerful correction could be in the cards later this Fall. Money flow also shows a shift to institutional selling over the past several weeks. Further information about our technical call is available upon request.
Conclusion
We believe that stocks are at risk of a correction that could reflect an impending recession in the economy. Government deficit spending will reduce liquidity in the markets as new bonds are sold to investors over the next several weeks. Inflation may also playing the equation, forcing the Fed to hike rates further. The impact of higher rates on corporate earnings, government budget deficits and consumer spending could be a powerful force that threatens valuations which are at, or approaching, historic peak levels.
Additional Information Available Upon Request
from "market" - Google News https://ift.tt/pCIqbt2
via IFTTT


Comments
Post a Comment